
Why NUMA affinity matters for distributed training on Kubernetes: 1.1% more throughput from one torchrun flag
Why NUMA affinity matters for distributed training on Kubernetes: 1.1% more throughput from one torchrun flag
GPU scheduling is only one part of workload placement. Once a pod has been assigned its GPUs, the processes inside it still need to interact with host CPUs, memory, and PCIe devices, and on a multi-socket server, where those processes run affects how efficiently the whole system works. This is familiar territory for Slurm users, who can bind tasks to CPU cores, sockets, and NUMA locality domains at launch. Kubernetes, however, schedules containers rather than individual PyTorch ranks. Unless another layer takes care of process placement, workers launched inside the same pod may compete for CPU cores or run farther from their assigned GPUs than necessary.
In PyTorch 2.9 and later, torchrun closes this gap with a single launcher flag. We measured its effect on a DeepSeek V3 pretraining workload running with Megatron Bridge on 192 NVIDIA B300 GPUs in Managed Service for Kubernetes on Nebius AI Cloud. Exclusive NUMA binding reduced mean training step time by 1.11% and increased model throughput per GPU by 1.13%. On a single GPU that is a small difference; across a large cluster and a long-running training job, it is compute recovered without changing the model or adding hardware.
In this post, we’ll explain how NUMA-aware process affinity works, compare it with the controls Slurm users already have, and walk through the measurement.
A GPU does not operate in isolation
Modern GPU servers contain several types of topology at once. CPUs are divided across sockets, each with local memory controllers. GPUs and network adapters connect through particular PCIe roots. CPU cores are grouped into NUMA nodes, and access to memory or devices attached to another NUMA node may take a less direct path.
NUMA, non-uniform memory access, names the central property of this architecture: not every memory access has the same cost. A CPU core can access memory attached to its local NUMA node directly. Accessing memory attached to another node requires traffic to cross the inter-socket fabric, which adds latency and consumes bandwidth.
The same locality matters when a host process coordinates work on a GPU. Training is GPU-intensive, but it is not CPU-free. Python workers prepare batches, runtime threads launch kernels, communication libraries manage progress and control paths, and pinned host memory may be used for transfers. When a process moves between CPU cores or operates far from the PCIe root associated with its GPU, the resulting overhead can appear as longer step times or greater variation between steps.
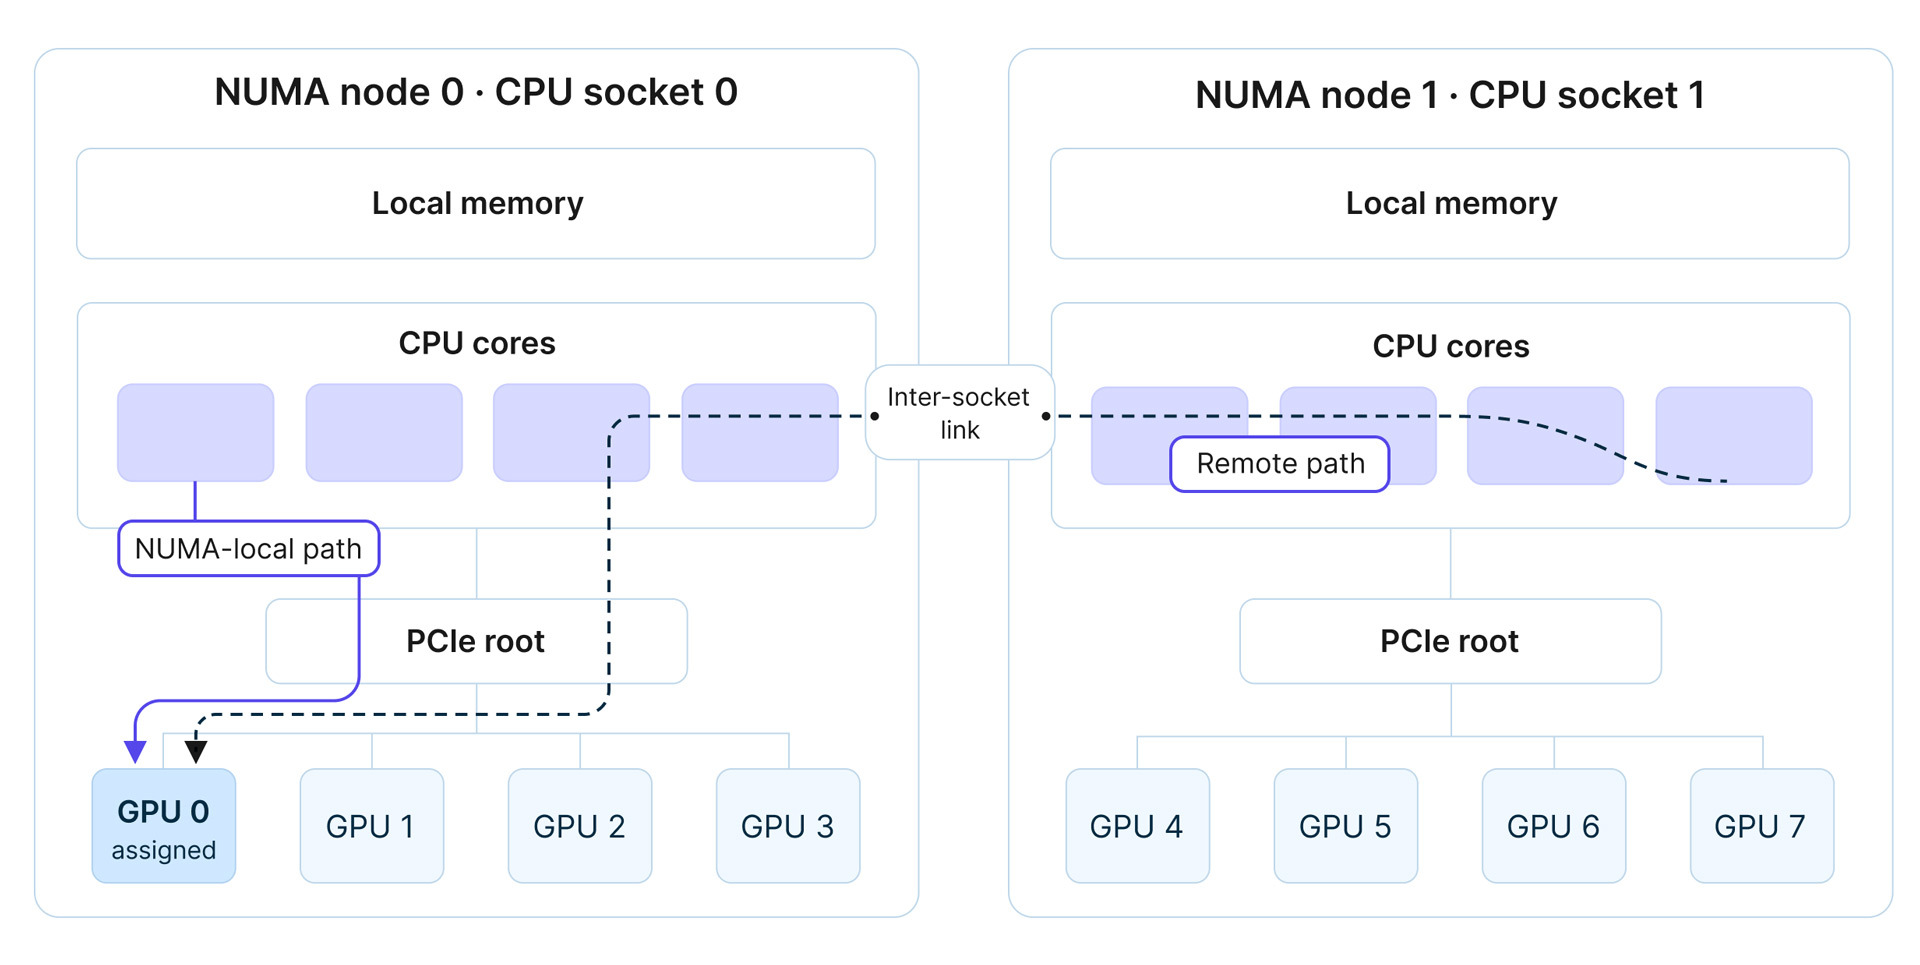 Figure 1. Simplified topology of a two-socket GPU server. A NUMA-aware worker uses CPU cores close to its assigned GPU; a remote path crosses the inter-socket link. Exact topology varies by server.
These effects depend on the workload. A training job that spends nearly all its time in long GPU kernels may show little difference. Workloads with more host-side activity, frequent synchronization, input processing, or communication can be more sensitive. The only reliable way to determine the effect is to control the placement and measure it.
How Slurm handles process affinity
Slurm treats task placement as part of launching a workload. Through srun, tasks can be bound to threads, cores, sockets, or NUMA locality domains. Slurm can also bind tasks to GPUs and apply a separate memory policy. Depending on cluster configuration and the requested resources, some CPU binding may be applied automatically.
A simplified Slurm launch can look like this. Replace CORES_PER_RANK with the number of CPU cores allocated to each rank on your nodes.
srun \
  --nodes=24 \
  --ntasks-per-node=8 \
  --gpus-per-task=1 \
  --cpus-per-task=CORES_PER_RANK \
  --cpu-bind=verbose,cores \
  --mem-bind=local \
  python train.py
The exact options depend on the node topology and Slurm configuration. Because the launcher knows about tasks and their allocated resources, it can set affinity before each task starts. --cpu-bind=verbose also reports the masks that were applied, making the resulting placement visible. Slurm documents the available binding levels and their precedence in its resource-binding guide and srun reference.
Kubernetes stops at the pod boundary
Kubernetes operates at a different level. It decides which node should run a pod and enforces the pod’s resource constraints. A distributed training container on an 8-GPU node can then launch eight PyTorch workers, one per GPU, but Kubernetes does not inherently decide which subset of the pod’s CPUs each rank should use. That responsibility belongs to the runtime or process launcher.
This distinction is easy to overlook. The pod is scheduled correctly, all GPUs are visible, and training starts successfully, yet the rank-to-CPU placement inside the container may still be suboptimal.
Topology-aware binding in torchrun
PyTorch exposes NUMA binding directly through torchrun. The launcher uses the local rank to identify the corresponding accelerator, discovers the accelerator’s NUMA node through its PCI address, and selects an appropriate set of allowed CPU cores.
Four placement modes are available:
node: Bind each worker to all allowed CPUs in the NUMA node associated with its GPU.socket: Bind each worker to all allowed CPUs in the CPU socket associated with its GPU.exclusive: Divide the physical cores of a NUMA node among its local GPUs and give every worker a non-overlapping subset.core-complex: Place workers on separate groups of cores that share a last-level cache, where the topology allows it.
PyTorch recommends node as the general default. We used exclusive because eight workers run on every server, and we wanted each worker to have local CPU capacity without sharing the same cores with another training rank. The behavior of each mode is described in the PyTorch NUMA binding documentation.
The change to the launch command is one line:
torchrun \
  --nnodes=24 \
  --nproc-per-node=8 \
  --node-rank="${RANK}" \
  --master-addr="${MASTER_ADDR}" \
  --master-port="${MASTER_PORT}" \
  --numa-binding=exclusive \
  train.py
For a command-line entrypoint, PyTorch applies the resulting CPU list with numactl --physcpubind. It also intersects the topology-derived list with the CPUs already available to the process. This is important in a container: the launcher stays within the affinity constraints presented to the pod rather than assuming it owns every CPU on the host.
--numa-binding controls where the worker runs, but it does not guarantee where every memory page is allocated. Pinning the worker to CPUs close to its GPU still tends to improve locality: Linux usually allocates memory on the NUMA node that first accesses it, while CPU affinity prevents the worker’s threads from drifting between sockets. Slurm treats memory placement separately through --mem-bind, which can apply a preferred or enforced memory policy.
Measuring the effect on DeepSeek V3 pretraining
To measure the impact, we used the DeepSeek V3 pretraining recipe from Megatron Bridge. The workload ran on the same 24 dedicated nodes for both configurations, with no other workloads using the nodes during either run.
The two configurations were identical apart from NUMA binding:
- Baseline: standard
torchrunplacement without an explicit NUMA policy. - NUMA-aware:
torchrun--numa-binding=exclusive.
The workload used 192 NVIDIA B300 GPUs across 24 nodes, with 8 GPUs per node. We ran the 685.39-billion-parameter DeepSeek V3 configuration in MXFP8, orchestrated by Volcano on Managed Kubernetes and launched with torchrun. The experiment focuses on the training compute loop and process placement. It is not intended to measure storage or production data-ingestion performance.
Initialization behaves differently from steady-state training. The first iterations include model setup, memory allocation, and CUDA Graph capture, so including them would obscure a relatively small placement effect. We evaluated 450 steady-state iterations for each configuration.
Results: approximately 1.1% more throughput
Exclusive NUMA binding reduced mean step time from 17.005 seconds to 16.816 seconds. Model throughput increased from 1,002.0 to 1,013.3 model TFLOP/s/GPU.
| Metric | Baseline | Exclusive NUMA binding | Change |
|---|---|---|---|
| Mean step time | 17.005 s | 16.816 s | 1.11% lower |
| Mean model throughput | 1,002.0 TFLOP/s/GPU | 1,013.3 TFLOP/s/GPU | 1.13% higher |
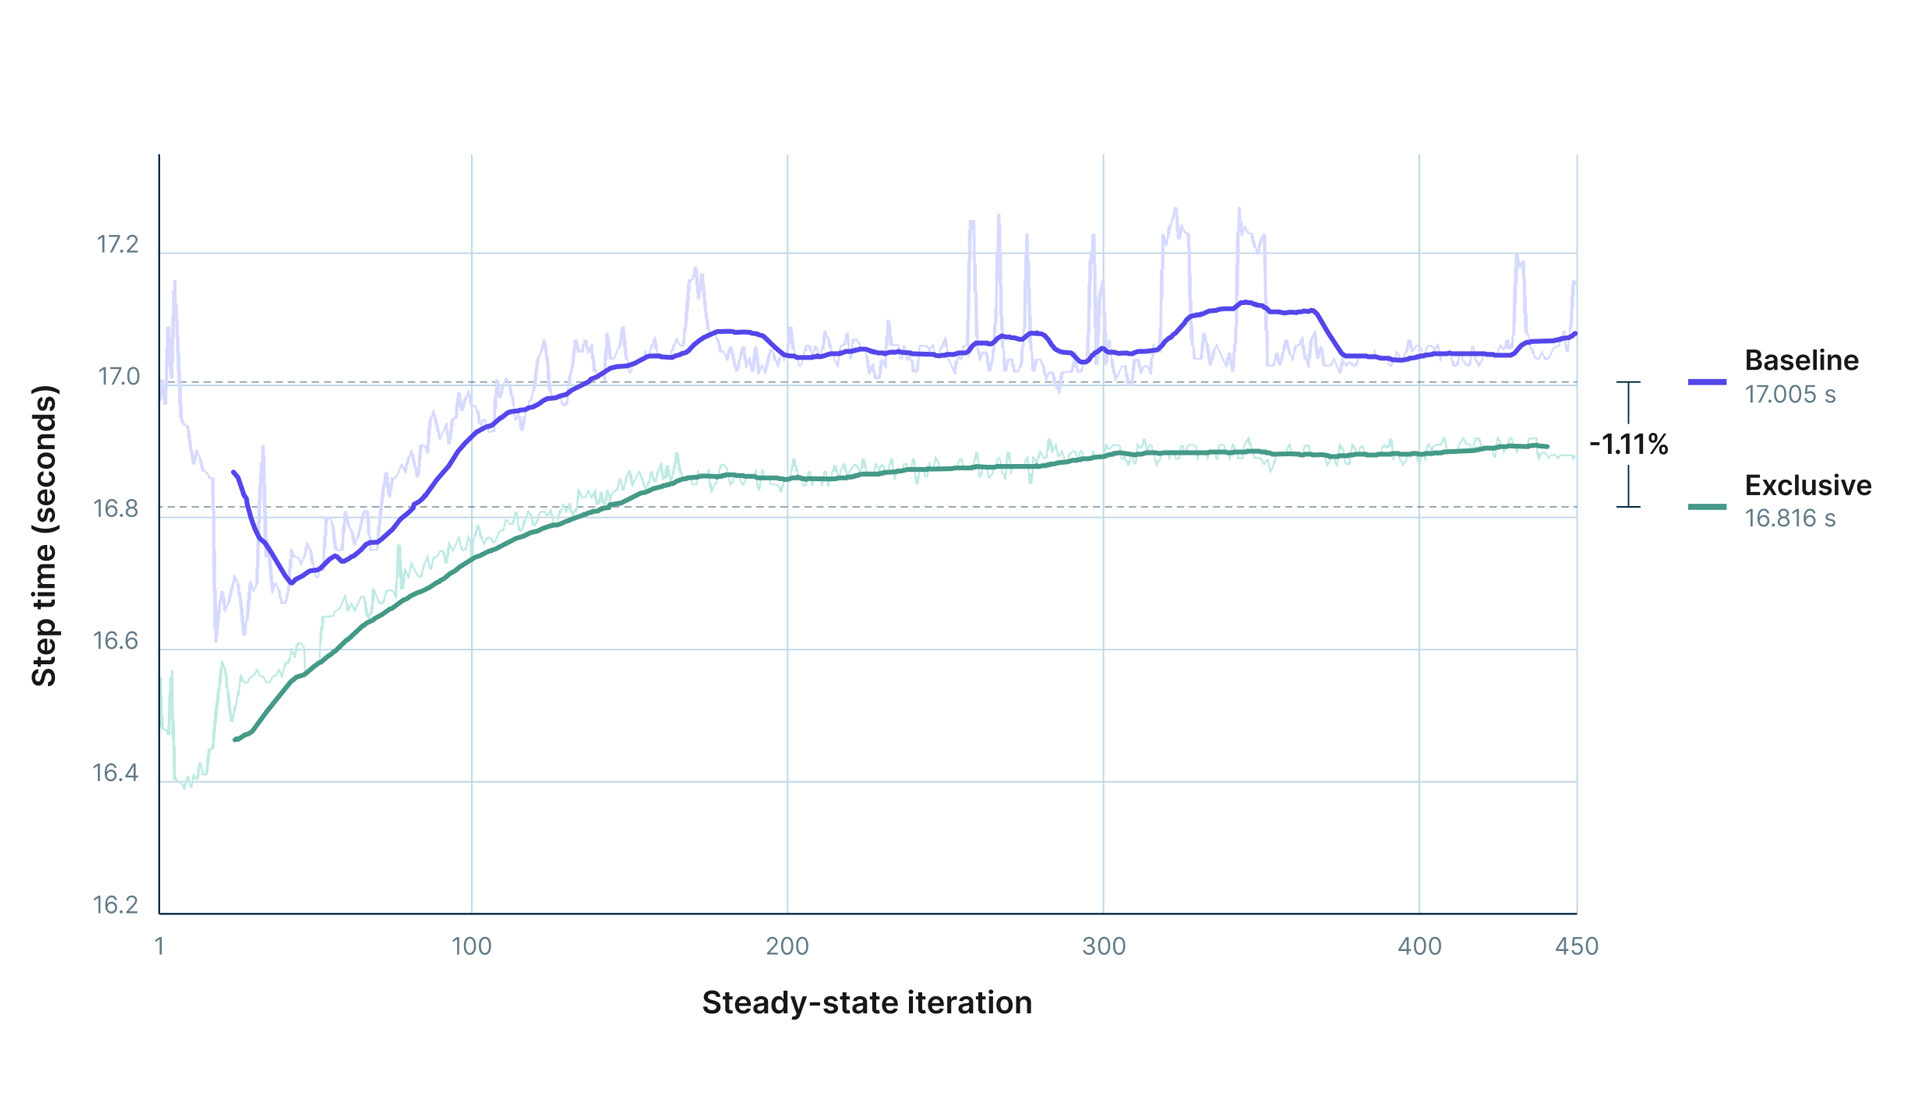 Figure 2. Step time over the 450-iteration measurement window. Faint lines show individual iterations; solid lines show the 25-step rolling mean. Dashed lines mark the mean for each run.
The difference persisted across the measurement window rather than coming from one or two unusually fast steps. Step time in both runs rose over roughly the first 150–200 iterations of the window before flattening, but the NUMA-aware configuration remained faster through the end of the comparison.
The benchmark does not by itself attribute every saved millisecond to a particular host-side operation. Doing so would require a more detailed CPU, memory, and PCIe profile. The result is, however, consistent with the mechanisms that affinity is designed to improve: fewer worker migrations, less competition between ranks for the same CPU cores, and more predictable locality between each rank and its GPU.
PyTorch notes that NUMA binding commonly produces an overall improvement of 1–10%, while some workloads may see a larger benefit or none at all. Our result sits near the lower end of that range. Affinity’s effect should be measured for the actual model, node topology, and input pipeline.
Read how we tuned the communication side of the same model on NVIDIA Blackwell: Inside the Nebius + PyTorch DeepSeek V3 recipe
Why one percentage point matters at cluster scale
A 1.13% throughput improvement can appear unremarkable on a single accelerator. On a 192-GPU workload, the arithmetic equivalent is a little more than 2 GPUs' worth of baseline aggregate throughput, recovered through process placement alone. Distributed training layouts have fixed divisibility and communication constraints, so adding 2 GPUs to an existing parallel configuration would not scale perfectly; the comparison only sizes the gain. A small per-GPU improvement becomes material when it applies to every accelerator on the cluster and persists over a long job.
The configuration change requires no modification to the model architecture, numerical format, or parallelism strategy; it makes better use of the hardware after those larger decisions have been made.
There is another benefit beyond the mean: predictability. Distributed training advances at the speed of its slowest participating rank. If poor CPU placement creates occasional delays on one worker, every other worker can end up waiting at the next synchronization point. Non-overlapping, topology-aware CPU sets reduce one source of host-side contention and make process placement easier to reason about when investigating performance variation.
Practical guidance for Kubernetes workloads
The best affinity mode depends on the server and workload. The following process is a useful starting point.
- Inspect the CPU, NUMA, GPU, and PCIe topology of the node.
- Check which CPUs are available inside the training container.
- Start with
--numa-binding=node, or testexclusivewhen several GPU workers share a NUMA node. - Compare steady-state step time and variation over a sufficiently long measurement window.
- Keep the model, nodes, software, and other workloads unchanged between tests.
Binding can also interact with supporting processes. Data-loader workers and child processes normally inherit the affinity of their parent, which is often desirable. However, a rank given too few CPU cores can become CPU-constrained, particularly when input preprocessing is heavy. More restrictive placement is not automatically better; it must leave enough host capacity for the work each rank performs.
Container CPU limits and cpusets matter as well. Because torchrun can divide only the CPUs that the worker is allowed to use, cluster-level CPU allocation, Kubernetes CPU management, and launcher-level NUMA binding should be treated as layers of the same placement problem.
Finding performance that was already there
GPU performance work often concentrates on model kernels, collective communication, and network bandwidth. Those are central to distributed training, but the host topology still matters. A job can have the right GPUs, a fast InfiniBand fabric, and a carefully tuned parallelism strategy while leaving performance on the table through unconstrained process placement.
Slurm users have long had task affinity close to the workload launcher. With NUMA-aware binding in torchrun, PyTorch workloads on Kubernetes can apply the same underlying principle without introducing Slurm solely for process placement.
In our 192-GPU DeepSeek V3 experiment, the result was approximately 1.1% more throughput from the same hardware. The precise gain will vary, and some workloads will not benefit. But affinity is cheap to test and increasingly important as training jobs scale across more accelerators. At that scale, recovering even one percentage point is worth the one line it takes to try.
Run it on your own workload today
Reproducing our test takes a Managed Kubernetes cluster with 24 instances of NVIDIA HGX B300, Volcano for gang scheduling, and the Megatron Bridge DeepSeek V3 recipe from the NVIDIA NeMo™ Framework 26.06 release.
Spin up a cluster on Managed Service for Kubernetes, add --numa-binding=exclusive to your torchrun launch, and compare steady-state step time on your own workload.
Explore Nebius Token Factory


Contents
- A GPU does not operate in isolation
- How Slurm handles process affinity
- Kubernetes stops at the pod boundary
- Topology-aware binding in torchrun
- Measuring the effect on DeepSeek V3 pretraining
- Results: approximately 1.1% more throughput
- Why one percentage point matters at cluster scale
- Practical guidance for Kubernetes workloads
- Finding performance that was already there
- Run it on your own workload today
See also

The team behind Nebius Managed PostgreSQL explains how and why it was built specifically for AI workloads.
We describe how it’s built on CloudNativePG and Kubernetes, why replacing Barman with WAL-G cut a 1.5 TB backup from more than a day to 2 hours, and how PgBouncer, point-in-time recovery, pgvector, and pgvectorscale fit bursty AI workloads.
SemiAnalysis has named Nebius a Platinum AI cloud provider, the top tier of its ClusterMAX™ 3.0 rating. The rating is based on live testing of production clusters: burn-ins, storage under concurrent load, and automated failure recovery on real NVIDIA GB300 and NVIDIA HGX B300 hardware. This post covers what the testing found and why it matters for teams choosing where to run production AI.
Introducing Aether 3.6. Our latest quarterly platform release responds to how AI teams now operate at scale and with maturity, delivering a smoother developer experience, a stronger security and compliance foundation, advances across our in-house storage portfolio, and natural-language control over your AI cloud.